eFX Apex
The Institutional-Grade Data Hub
- Plus: Discretionary Trades
- Edge: Sentiment Trades
- Alpha: Systematic Trades
- Apex: Full Big Data Stream


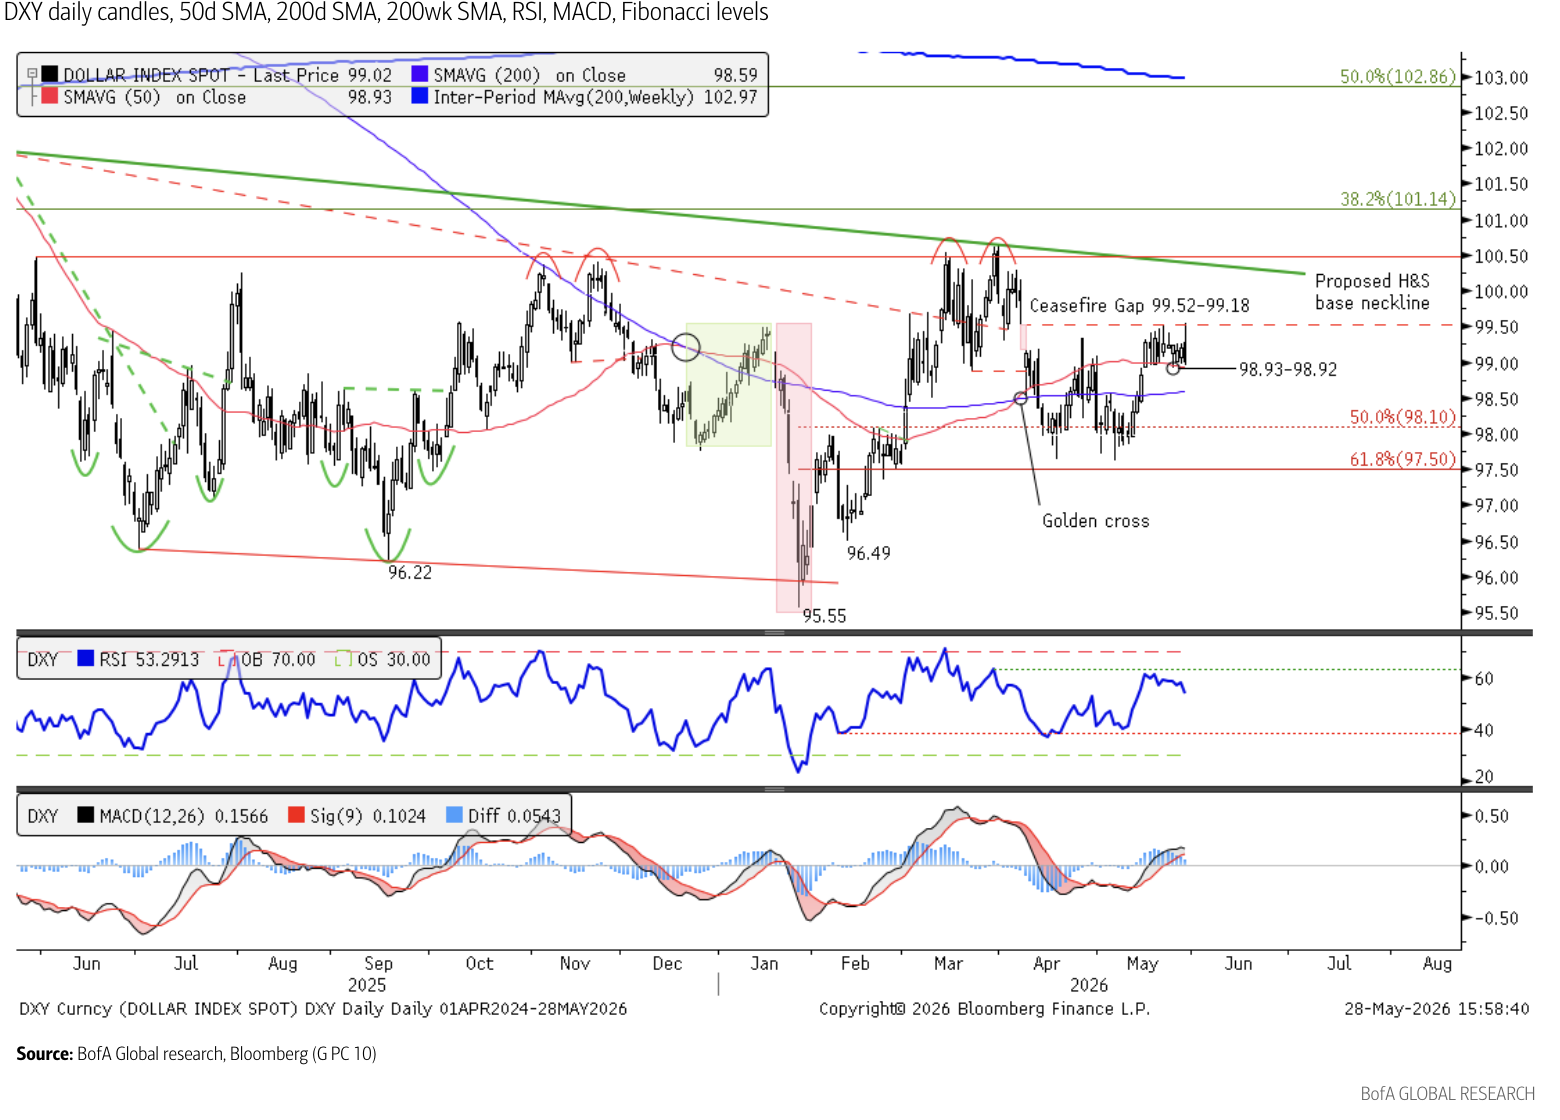
Bank of America Global Research discusses the USD Index (DXY) technical outlook and flags the 98.93. level as a critical support that needs to hold for a move towards 100.38 ahead of 103.
"After filling the bearish April 7 gap caused by the US-Iran ceasefire, markets initially faded the DXY back toward the 50-day SMA now at 98.93. Ideally this holds to form a higher low and shift focus to weekly neckline resistance at 100.38, then the top of the year-long range at 100.64. A breakout above these levels would confirm a weekly base in favor of upside toward 103," BofA notes.
"However, the DXY's weak close on May 28 suggests another test of the 200-day SMA at 98.59 is possible. A hold and turn higher from there would still preserve a higher low versus early May and sustain the near-term uptrend. A close below 98.59 would weaken the bullish setup. The 61.8% Fibonacci retracement at 97.50 remains critical support to preserve the bullish base case for DXY," BofA adds.